FORECAST/eLOAD
-
07.08.2020 Industrial excess heat for district heating: Database shows great potential for supplying households
Excess heat from energy-intensive industries is often suitable for use in district heating systems but is usually unutilized. A detailed overview of the potentials available in the EU is now provided by a database of the sEEnergies project. In Germany, 29 petajoules of excess heat from industrial sites could be used, which corresponds to the demand of more than half a million households. The information is available as maps and downloadable datasets.
Methodology
annual energy demand
Overview
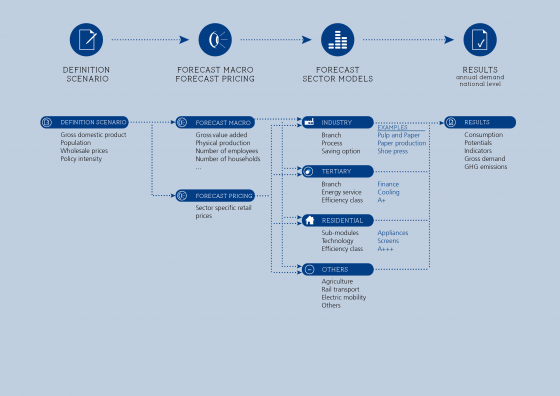
The FORECAST
modelling platform aims to develop long-term scenarios for future energy demand
of individual countries and world regions until 2050. It is based on a
bottom-up modelling approach considering the dynamics of technologies and
socio-economic drivers. The model allows to address various research questions
related to energy demand including scenarios for the future demand of
individual energy carriers like electricity or natural gas, calculating energy
saving potentials and the impact on greenhouse gas (GHG) emissions as well as
abatement cost curves and ex-ante policy impact assessments.
Model structure
The FORECAST
platform comprises four individual modules, each representing one sector
according to the Eurostat (or national) energy balances: industry,
services/tertiary, residential and others (agriculture and transport). While
all sector modules follow a similar bottom-up methodology, they also consider
the particularities of each sector like technology structure, heterogeneity of
actors and data availability.
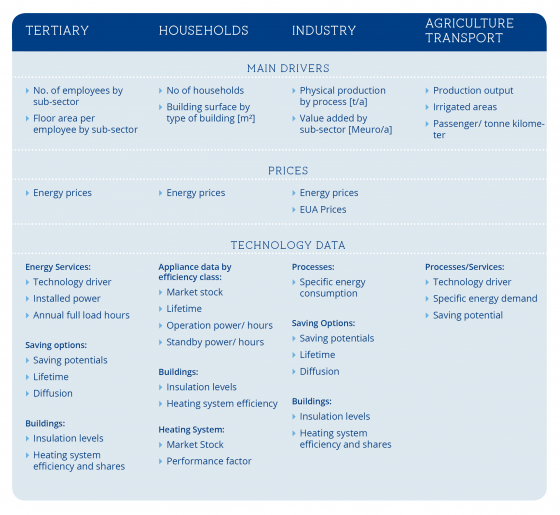
The list of
selected input data as shown in the following table provides a broad idea of
the level of detail of each module. Each sector requires sector specific
activity data, like industrial production in the industry sector and the number
of households in the residential sector. Furthermore, end-consumer energy
prices play an important role in each sector as they are distinguished by
energy carrier. The third group of input data, the technology characterisation
also reflects data availability of the individual sectors. While in the
industry and tertiary sector the model works with so-called energy-efficiency
measures (EEMs), which represent all kinds of actions that reduce specific
energy consumption, in the residential sector the stock of alternative
appliances and the market share of different efficiency classes is explicitly
modelled. In all cases, energy savings can be calculated and traced back to
technological dynamics including cost considerations.
Modeling investment decisions
The bottom-up approach, which distinguishes
individual technologies, allows modeling the diffusion of technologies as the
result of individual investment decisions taken over time. For all types of
investment decisions, the model follows a simulation approach rather than
optimization in order to better capture the real-life behavior of companies and
households.
Whenever possible, the investment decision is
modeled as a discrete choice process, where households or companies choose
among alternative technologies to satisfy a certain energy service. It is
implemented as a logit-approach considering the total cost of ownership (TCO)
of an investment plus other intangible costs. This approach ensures that even
if one technology choice is more cost-effective than the others, it will not
gain a 100% market share. This effect reflects heterogeneity in the market,
niche markets and non-rational behavior of companies and households, which is a
central capability to model policies. Still, the resulting technology
development (and energy demand) is price sensitive.
The replacement of
equipment/buildings/technologies is based on a vintage stock approach allowing
to realistically model the replacement of the capital stock considering its age
distribution. Some parts of the industrial and the tertiary sector are not
using a vintage stock approach, due to the huge heterogeneity of technologies on
the one hand and data scarcity on the other. Technology diffusion, however, is
modeled based on a similar simulation algorithm taking heterogeneity and
non-rational behavior into account.
Modeling policies
Modeling energy-efficiency policies is a core feature of the FORECAST model. The simulation algorithm and the vintage stock approach are well suited to simulate most types of policies.
Minimum energy performance standards (MEPS),
e.g. for appliances or buildings, can easily be modeled by restricting the
market share of new appliances starting in the year the standards come into
force. See Elsland et al. (2013) and Jakob et al. (2013) for examples of
ex-ante impact assessments of the EU-Ecodesign Directive.
Energy taxes for end-consumers can be modeled
explicitly on the basis of more than 10 individual energy carriers
(electricity, light fuel oil, heavy fuel oil, natural gas, lignite, hard coal,
district heating, biomass, etc.).
Information-based
policies are
generally the most complicated to model due to their rather “qualitative
character”. The discrete-choice approach, however, allows to consider such
qualitative factors. E.g. labeling of appliances resulting from the EU Labeling
Directive can be modeled by adjusting the logit parameters and thus assuming a less
heterogeneous market, in which a higher share of consumers will select the
appliance with the lowest total cost of ownership. See for example Elsland et
al. (2013).
EU emissions trading can be modeled in the form of a CO 2 tax for energy-intensive industries. The detailed technology disaggregation in the industrial sector considering more than 60 individual products allows to consider the scope of the EU ETS on a very detailed level (examples of products are: clinker, flat glass, container glass, primary and secondary aluminium, oxygen steel, electric steel, coke, sinter, paper, ceramics, ammonia, adipic acid, chlorine). See Fleiter et al. (2012) for a case study on the German paper industry taking EUA prices into account.
Database
The FORECAST database has improved
continuously incorporating the results/extensions from the above-mentioned
studies.
The
main economic input like energy
balances, employment, value added or energy
prices are calibrated to most recent EUROSTAT statistics whenever possible.
When such data was not available (prices for certain energy carriers) IEA data
was used to fill the gaps.
In the following an overview of the
main sources is provided by model segment for technology-related data not
available in EUROSTAT :
Buildings and heating systems: Buildings Performance Institute Europe (BPIE), IEE project TABULA, IEA Building Energy Efficiency Policies (BEEP), IEE project EPISCOPE, ODYSSEE database, country specific research e.g. for heat pumps
Appliances residential sector: Ecodesign Directive preparatory studies, ODYSSEE database, market research data from GfK
Appliances tertiary sector : Ecodesign Directive preparatory studies and additional individual
technology studies.
Industrial production : PRODCOM when possible, UN commodity production database, US geological survey, UNFCCC, industry organizations (World steel organization, CEPI, Cembureau, Eurochlor, etc.)
Industry cross-cutting technologies : various technology studies of which many are EU projects
Industry process technologies : IPPC BREF studies, numerous
technology/sectoral studies
Besides these sources, many more, even country specific sources, statistics and reports are used to feed the model database.
spatially distributed annual electricity demand
Overview
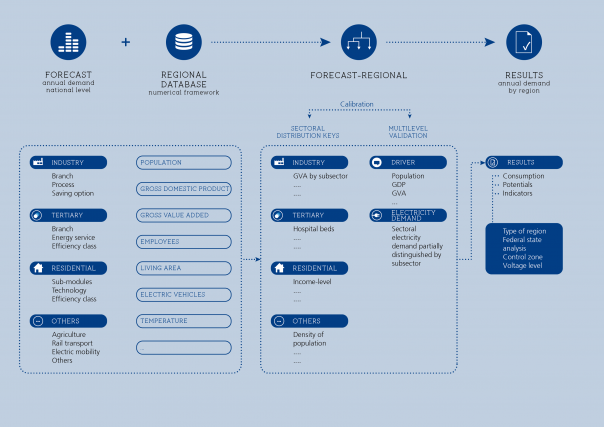
FORECAST-Regional is applied in a subsequent step to the FORECAST model. In this way, the granularity of FORECAST results is used to generate downstream a spatial resolution of electricity demand, which generates differentiated conclusions about the individual regional units. Hence, this regionalisation approach is implemented as a two-step-process: (i) the national electricity demand is calculated based on FORECAST and (ii) a regional allocation is estimated by applying sectoral distribution keys via FORECAST-Regional.
Model structure
The national electricity demand is spatially
resolved by FORECAST-Regional in a step subsequent to the FORECAST model.
Besides the national electricity demand the data input of FORECAST-Regional is based
on the Regional Database, which represents the numerical framework for the
spatial resolution. In terms of methodology, sectoral distribution keys are
applied to split electricity demand into regional units (e.g. gross value added
per sub-sector, population density per region). This approach leads to a
breakdown of the national electricity demand by districts/municipalities. In
parallel with this, the drivers and electricity demand are compared with
official statistics at a regional level for selected large German cities and on
a district level by state: the so-called Multilevel Validation. The results of
FORECAST-Regional are calculated as total consumption, potentials and
indicators. Subsequently, a clustering of the regions by structural characteristics
and control zone of the transmission system operator (TSO) is accomplished to
provide a sufficient framework for result analysis.
Sectoral distribution keys
National electricity
demand is broken down by region using sectoral top-down distribution keys,
which are derived from demand theory. The objective is to transform the heterogeneous
composition of national electricity demand into regional structures. Hence,
given the modelling of national electricity demand in FORECAST, and considering
sectoral differences, a unified methodical approach is applied. Examples
include the differentiation of electricity demand of the household sector by
appliances/lighting, electricity demand of heating systems attributed to hot
water generation, electricity demand of heating systems attributed to space
heating and electricity demand attributed to small appliances. This distinction
is based on existing studies and allows effects such as the share of
electricity based heating systems to be examined. Within FORECAST-Regional the
following parameters differentiated by electricity demand categories are used
for the sectoral distribution keys:
- Residential
sector:
Appliances/lighting: specific electricity demand per size of household, households by number of inhabitants, disposable income
Hot water : specific electricity demand per size of household, households by number of inhabitants, disposable income
Space heating : specific electricity demand per size of household, number of households living area per household, disposable income, climate factor (primarily capturing temperature and radiation), binary variable if an electricity-based heating system is available in a household
Residual : specific electricity demand per inhabitant, disposable income, number of inhabitants - Tertiary sector:
Healthcare : specific electricity demand per process, employee by subsector, floor area per employee by subsector, gross value added by subsector, hospital beds
Education : specific electricity demand per process, employee by subsector, floor area per employee by subsector, gross value added by subsector, number of students
Residual subsectors : specific electricity demand per process, employee by subsector, floor area per employee by subsector, gross value added by subsector - Industry sector:
Energy intensive industry: specific electricity demand per process, gross value added by subsector, locations, production capacity
Non-energy intensive industry: specific electricity demand per process, gross value added by subsector - Agricultural sector:
specific
electricity demand per gross value added, gross value added
- Electro mobility:
specific
electricity demand per capita, certifications of electric vehicles, population,
surface per regional unit
-
Others (mainly railroad transport):
specific
electricity demand per gross value added, gross value added
The data basis with the highest granularity available is used to transform this parameter set into sectoral distribution keys. However, since the data availability is restricted for some subsectors, ratios of national levels are used to fill the data gap. This provides consistent values from a top-down perspective, however, from a bottom-up perspective this approach can lead to regional miscalculations. Furthermore, if there is no location-specific data for the electricity consumption or any sufficient basis for analogous assumptions available, the approach is based on the assumption that the technological structure within the considered category is homogeneous. This means, that in the case of the production of one ton of steel in plant A, the same specific consumption would be used to decompose electricity demand for plant B. This procedure accounts for the restricted availability of data.
Multilevel validation
The multilevel validation is an approach to establish a correct balance on various administrative levels of structural data and sectoral electricity demand. Balancing means that a comparison between regionalised electricity demand, resulting from a distribution key-based break down, and historical data for large cities, federal states and on a national level is accomplished. On the one hand, this would allow the detection of possible reasons for the deviations caused by the top-down approach differentiated by input and output data. On the other hand, the Multilevel Validation approach can be used to recalibrate the distribution keys. This method of validation, compared to the conventional regionalisation approaches discussed in section II is an essential feature of this new approach; the validation is usually based on a comparison to the national electricity demand without considering the consistency of levels in between. To generate complete data consistency with the national FORECAST data, any remaining deviation needs to be eliminated by normalisation. This normalisation is accomplished in a two-step-process: (i) for the drivers, to eliminate the driver-attributed deviations and, (ii) for the electricity demand. A comparison of the various data sources used shows that even in a theoretical case of perfectly calibrated distribution keys a normalisation is still needed. This is because the sources are usually based on different methodological approaches for balancing and data collection and so minimal deviations will always occur.
Database
The Regional Database contains data for all parameters needed for the spatial resolution. The selection of data is oriented towards the typical drivers that are used for ex ante analysis in bottom-up energy demand models. The selection is therefore consistent with the activity drivers of FORECAST . According to FORECAST, a differentiation is made by cross-sectoral and sector-specific drivers; these are primarily:
- cross-sectoral: population and gross domestic product (GDP)
- sector-specific:
gross value added (GVA), employees, living area, number of electric
vehicles, disposable income, industry locations and capacities, hospital
beds, students, etc.
Furthermore, the climate conditions are captured by the climate factor that
comprises the combined impact of weather-caused effects on energy demand. The data collection is primarily based on public sources such as the
so-called ‚Regionendatenbank‘ and ‚Gemeindeverzeichnis-Informationssystem‘ of
the Federal Bureau of Statistics (DESTATIS), statistical offices of the federal
states, German Meteorological Service (DWD), Federal Motor Transport Authority
(KBA), Federal Office of Economics and Export Control (BAFA) and commercial
sources such as the ene’t database. The data are provided in different levels
of granularity for districts (NUTS 3), municipalities (LAU 2) or postal code
areas. There are particular challenges in the assumptions needed for the
distribution of NUTS 3 data to a LAU 2 level. To use the parameters of
the Regional Database for an ex ante analysis, the data needs to be available
for the entire horizon of analysis. The projection of data into the future in
the Regional Database is primarily based on the so-called ‘Raumordnungsprognose
2035’ of the Federal Institute for Research on Building, Urban Affairs and
Spatial Development (BBSR),
which particularly focuses on the questions of high spatially resolved
structural changes. The ‘Raumordnungsprognose 2035’ provides data for the
following parameters: population (by age groups), employees (by age groups and
sex) and households (by household size) on a district level for the period
1990-2035. As these parameters are projected at a district level, they already
include the net effect of interregional structural change. The other parameters
captured in the Regional Database, which are not included in the ‘Raumordnungsprognose
2035’, are extrapolated either by specific indicators (e.g. GDP per capita) or
by correlation analysis (e.g. there is a strong correlation between GVA and the
number of employees or between the GDP per capita and disposable income).
hourly electricity system load curves
Overview
The eLOAD (electricity
LOad curve ADjustment) model aims to estimate the long-term
evolution of electricity system load curves on a national level. Based on
appliance specific hourly load profiles and annual demand projections from the
FORECAST model eLOAD assesses the transformation of the load curve due to
structural changes on the demand side and the introduction of new appliances.
Analysing the future shape of the load curve gives insights into the
development of peak load, load levels and load ramp rates that are required for
investment decisions about new electricity generation capacity and grid
infrastructure. Apart from that, eLOAD allows to analyse load flexibility, i.e.
demand response (DR). Based on a mixed-integer optimisation the model
determines cost-optimal load shifting activities of suitable appliances such as
electric vehicles or storage heaters.
Model structure
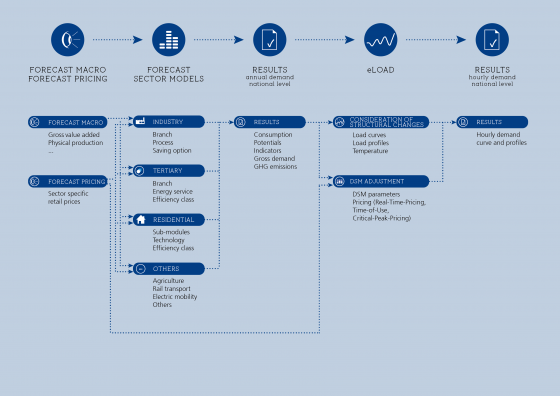
eLOAD aims to
estimate the future shape of the national electricity system load curves. It is
available for all countries of the EU27 until the year 2050. eLOAD consists of
two modules. The first module addresses the deformation of the load curve due
to structural changes on the demand side and the introduction of new appliances
(such as electric vehicles) by applying a partial decomposition approach. The
technology specific annual demand projection from the FORECAST model serves for
the identification of all “relevant appliances” that feature a significant
increase or decrease in electricity consumption over the projection horizon. By
using appliance specific load profiles, a load curve can be generated for all
relevant appliances for the base year, according to the respective annual
demand in the base year. These load curves are deduced from the system load
curve of the base year. The resulting remaining load curve and the appliance
specific load curves are then scaled for all projection years according to the
demand evolution. Reassembling the scaled remaining load and the scaled load
curves give the load curve of the projection year.
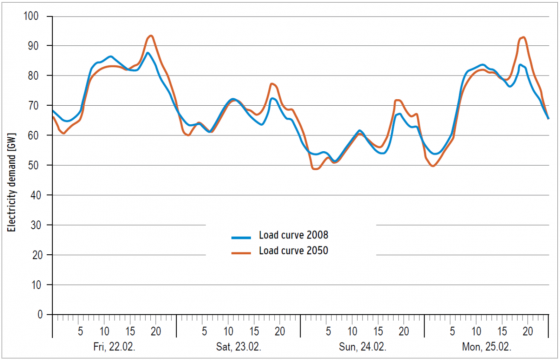
By using this
approach of partial decomposition, characteristic outliers and irregularities
can be conserved in the load curve while the general shape of the load curve is
adjusted according to the changes on the demand side. Figure 1 shows an
exemplary four-day extract of the German load curve for the years 2008 and
2050.
The second
module of eLOAD addresses the active adjustment of the load curve by means of
demand response activities. Based on the load curve of appliances that are
suitable for DR and taking into account techno-economic parameters and
restrictions of the appliances, a mixed-integer optimization is carried out
which determines the least-cost scheduling of the appliances in order to smooth
the net load (as the difference of the system load and the generation of
renewable energy sources).
Database
The database includes four types of data: hourly load profiles, historic load curves and a temperature time series as well as appliance specific demand response parameters.
The load profile data base comprises more than 500 hourly load profiles from various types of industrial, commercial and residential appliances or processes. The load profiles are available either for the length of an entire year (8760 hours) or as average profiles for typical days (distinguished by weekday, season and in the case of heating and cooling technologies by temperature). The data originate from various national and international surveys and field tests. Some national profiles are transferred to other countries by means of time use surveys.
Historic load curves are provided by Entso-e, temperature time series come from the MERRA data base of the NASA.
The
demand response parameters, required for the optimization part of eLOAD,
include information on the availability and restrictions of appliances suitable
for demand response activities as well as system information e.g. on the
tarification scheme.
© 2024 Fraunhofer ISI | Publishing Notes | Data Protection


